
From Feature Factory Chaos to Roadmap Clarity
How We Built High-Impact Roadmaps at Slack


Every growing product company eventually hits the same wall. Customers, prospects, and sales reps generate an endless stream of feature requests. Engineering capacity feels stretched. Marketing wants fresh stories to tell. Leadership is pushing for revenue growth, shorter sales cycles, and clear differentiation to drive up average contract value or sales prices.
The result, too often, is a roadmap that feels more like a reaction log than a strategy. The result is product teams are driven to implement features from the the customer or account executive who pushes most persistently (Squeaky Wheel); the person in the room with the biggest paycheck (HiPPO); or the last customer someone spoke to (recency bias).
If this is you, you’re in a feature factory. It is not sustainable, and the opportunity costs are enormous.
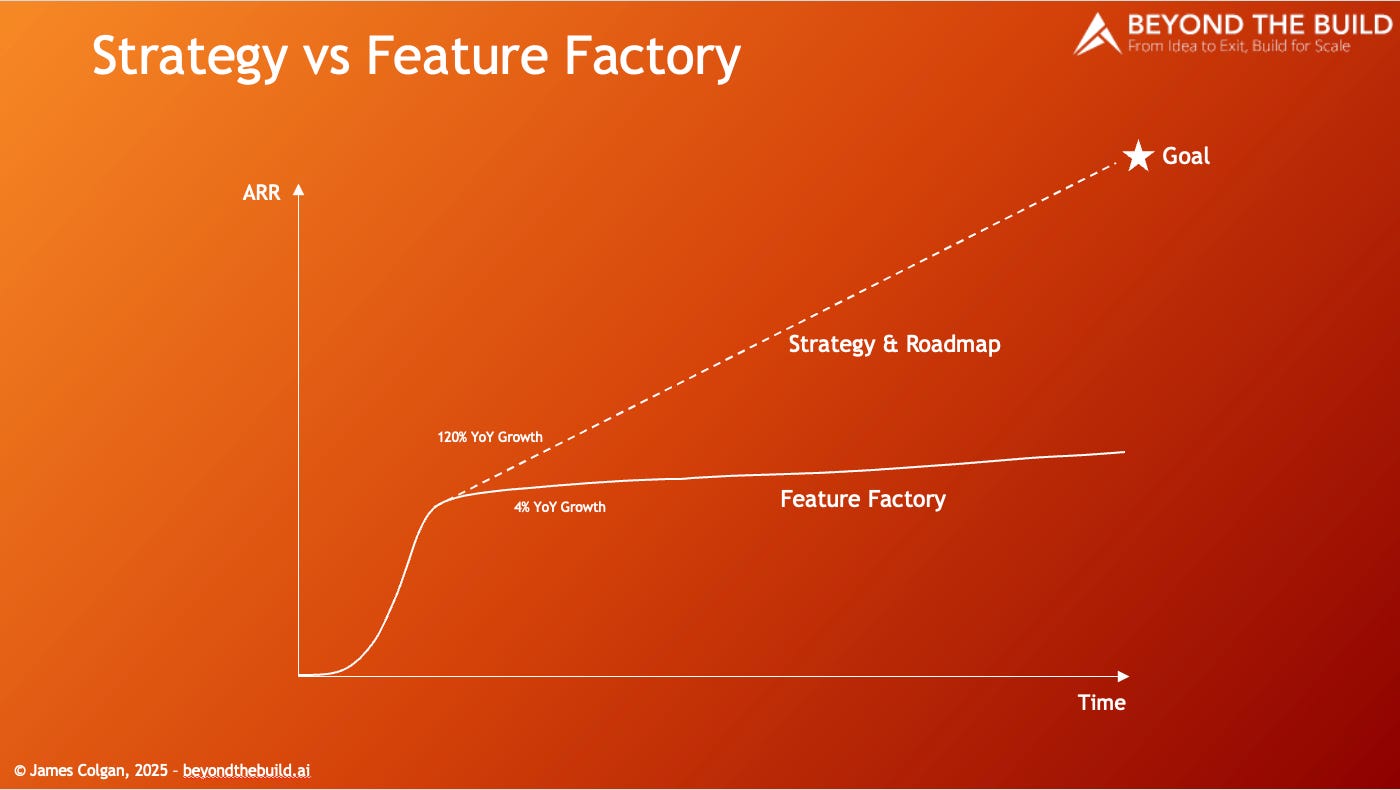
A roadmap should be a strategic asset. It should capture where the company is focusing, what customer problems are worth solving, and how product investment will drive business outcomes. The challenge is to take the long flat list of features the company could build and turn it into a thought-through roadmap of what they should build to meet the company’s goals.
Using examples from my experience at Slack and elsewhere, we’ll walk through a detailed process to turn chaos into clarity. A long list of seemingly disconnected features into a coherent roadmap.
Here are the steps I’ll detail. (🔒 for our paying community subscribers.)
Market segmentation: deciding who you’re building for and get alignment across the product and go-to-market organizations
🔒 Product Domain Mapping: how to get out of the weeds of features and focus on what matters
🔒 Jobs-to-be-Done: how to become customer-centric and business value-oriented
🔒 Kano value stack classification: how to make tradeoffs explicit and intentional
🔒 Goals, OKRs, and KPIs: how to align customer needs and business goals
🔒 Bring it all together: decide how to allocate investments across the value stack
🔒 Build the roadmap: where prioritization becomes real by balancing engineering capacity
By the end, you’ll see how to move from a messy list of asks to a structured system for prioritization that is repeatable, transparent, and strategic.
Why Every Product Company Needs a Prioritization Framework
Ideas are cheap and easy to come by. The difference between company success and failure is the speed of execution. And the greatest drag on execution is the speed and clarity of decision-making.
Without a clear decision-making framework, roadmaps become dominated by short-term pressure. This may feel like a successful approach as code is shipped and some sales are made. But it’s not sustainable as over time growth slows and frustration builds across the organization:
Sales feels blocked in deals.
Customer success struggles to manage churn.
Engineering suffers from whiplash as priorities shift.
Leadership sees a limited connection between roadmap items and financial outcomes.
In short, you’re living inside a Feature Factory at 4% annual revenue growth. And from the investors’ perspective, you’re building a lifestyle business and not a “rocket ship” that will deliver outsized returns on their investment.
A prioritization framework doesn’t eliminate tradeoffs, it makes them transparent. Instead of fighting over features, the team debates segment focus, value creation, and alignment with company goals. More than anything, it’s these debates and the decisions made where the value lives. These tough conversations are what build a healthier organization delivering better outcomes.
So, how do we do this? Read on!
Step 1: Define Market Segments
The first step is to get clarity about who you are serving now. Different customer segments have different requirements, costs to serve, and revenue potential.
For example:
An enterprise company with complex infrastructure may care deeply about integrations, compliance, and security.
A mid-market business using modern SaaS stacks may prioritize speed of setup and in-product dashboards.
In the early days of a company, when founder-led sales dominate and you’re in search of Product-Market Fit (PMF), you’ll take any customer meeting, close any deal, and build any feature just to show traction and validate hypotheses.
That’s great, to a point. Once you’ve gathered all of this data, you need to take a step back and ask yourself, “Who do we serve now?”. Even if you’re product is horizontal, you need focus to direct your finite resources. Product teams need to focus on a coherent set of capabilities to build, and your go-to-market (GTM) team needs to focus on a coherent set of prospects to increase sales predictability and velocity.
Treating every prospect as “the customer” does not help prioritization and focus.
How to define segments:
Vertical: industry, e.g., consumer packaged goods (CPG) , fintech, healthcare
Opportunity sizing: Total Addressable Market, number of prospects, growth profile
Size: SMB, mid-market, enterprise
Tech stack: Salesforce vs HubSpot, Slack vs Teams
Geography: US, EU, global
Regulatory profile: strict vs light
Buyer and user mix: marketers, IT, agencies, operations
Anchor each segment with real customer examples. Instead of abstract labels like “tech-forward enterprise,” use “Nike”. It makes planning and conversations more tangible. These are customers you’ve engaged with and understand their needs. Customer names connect the product and GTM teams and facilitate alignment.
The output of this exercise is a one-slide grid showing the different market segments and the key attributes of each. These can be stack-ranked by factoring in opportunity sizing, current product fit, and current GTM fit. Then choose one market segment to focus on for the next twelve months.
Step 2: Map Product Domains
All across the spectrum of company size, I have seen the same problem persist. At the early stage startups and scale-ups like Spendesk, mid-sized late-stage private companies like Envoy, growth rockets like Slack, and the global titan Microsoft. Energy-sapping debates pitting feature against feature with no context other than what each feature does for the immediate customer need.
If you’re building a product, and not just a feature, your users will traverse workflows through your product and across it. These User Journeys are a guide to break down a monolithic experience into different product domains. Each domain addresses a specific customer pain or need and represents a collection of features that, when used in concert, solve that pain, meet that need, and deliver value to the customer.
Using Slack as an example, domains could look like this:
Onboarding: how to quickly get users into the product
File Management: how users can easily see, manage, and share files within Slack
Calls: how users can easily communicate over voice and video within Slack
Time Management: how users can easily manage their time in Slack
Personalization: how a user can connect, configure, and otherwise customize Slack
Align on the language for what the product domain actually does. You now have a shared product map and vocabulary. As a first approximation, color each domain with a red, yellow, and green code as an indicator of how confident you are in that domain. This could be in terms of functional completeness, quality, or performance. You’ll refine what this means relative to the goal, but for now it will give folks a common sense of how the product is doing from an engineering perspective.
Crucially, instead of debating narrow features, the team can now discuss whether to strengthen “Time Management” or “File Management” domain and gain alignment across product, marketing, and sales about where you should invest and when without getting bogged down in the specifics of individual feartures.
Step 3: Capture Requirements as Jobs-to-Be-Done
Customers don’t buy features, they hire products to do jobs in the real world. They don’t want to buy a drink, they want to not feel thirsty. That’s why Jobs-to-Be-Done (JTBD) is a powerful framing to push your conversations and decision making away from your product and features and to the user and their needs. This is how you truly actualize customer centricity. Through deep empathy and understanding of the user’s context.
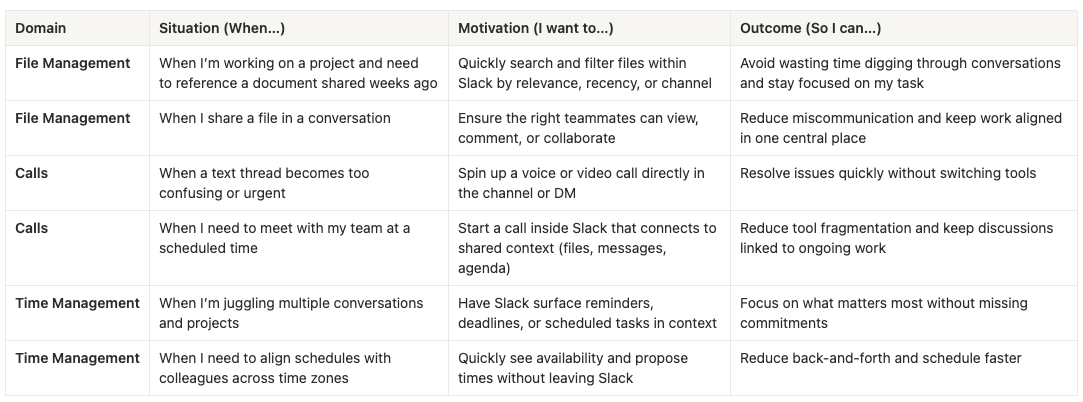
Within each defined domain, and for the example customer in your target market segment (Nike, in our example), capture the top two or three JTBDs. Larger companies like Slack and Microsoft have user research teams that can perform this exercise exhaustively (and we did). The reality is, for an earlier stage company with finite time and resources, you should be able to capture a tight list of JTBD within a focused brainstorming session involving folks who are close to the customer. Product Manager, Customer Success, Product Marketing, etc.
There are three components to a JTBD. The situation, the motivation, and the desired outcome. For example, “after running, I want a drink, so I no longer feel thirsty”.
In our Slack example, it looked something like this.
To rank and select your primary JTBD, consider the customer pain/need and the frequency they feel it. The higher the pain, the more valuable the solution. The more frequent the pain is felt, the higher the utility of the solution. A high-pain frequently felt is a valuable JTBD and somewhere resources should be focused to deliver a high-value solution that will increase your ACV, for example.
Once you’ve selected your JTBD, take a pass over the list and mark each with a simple red, yellow, green traffic light to indicate how well the product meets that need today. That gap analysis gives a clear and visual way to reveal your product strengths and weaknesses relative to your customer’s needs.
But don’t leap to any conclusions yet. We still have some important steps to go through. We need to understand and balance the value of the solution to the customer and the value of the solution to you - the company and business!
Step 4: Apply the Kano Model
Not all product gaps or JTBD have equal impact. On the customer or on the business. We need a methodology that enables us to map each opportunity relative to the potential return so we can rank and then plan what to build.
For this exercise, we use the Kano model. (I’m consistently shocked by how useful this model is for decision making and how little it is known and applied. Why is that?)
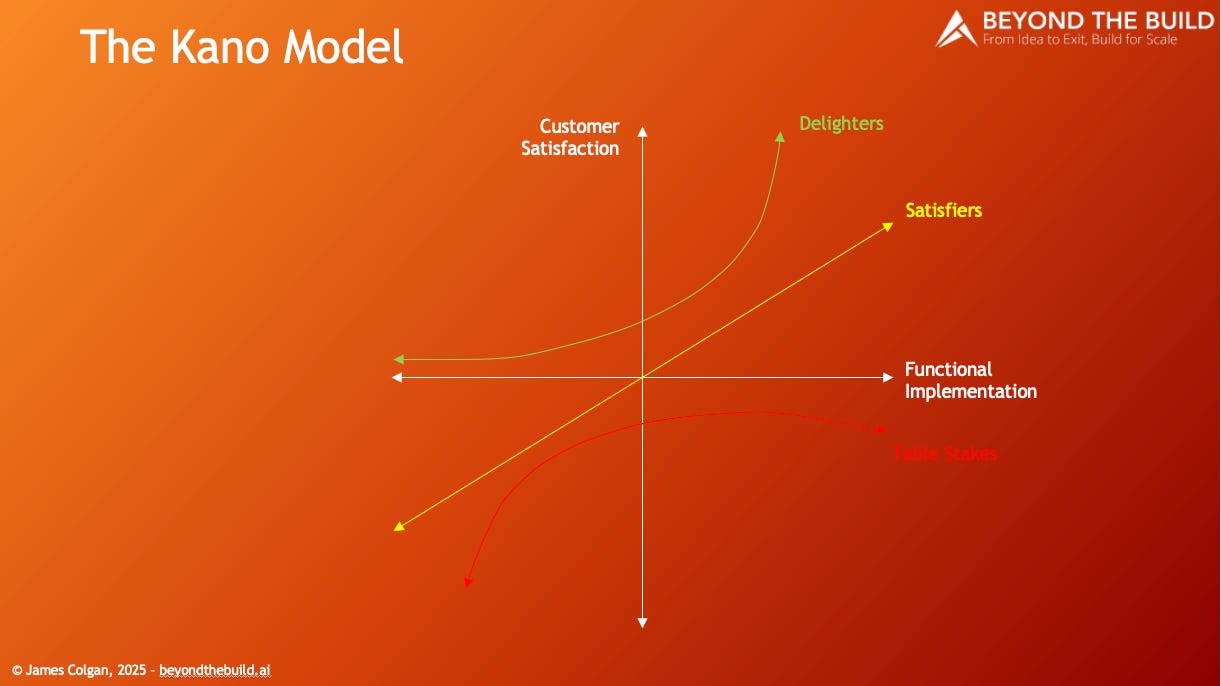
In summary, the model maps capabilities (JTBD) against two axes. The x-axis represents the degree to which the capability is built or delivered. On the far left, the feature is absent or poorly implemented (“missing”). Moving rightward, the feature is present, basic, functional, and eventually best-in-class or highly polished. It’s essentially the supply side: how much capability the product provides in the feature.
The y-axis represents the emotional response or satisfaction the customer feels from the presence of the capability. At the bottom, the feature causes frustration or dissatisfaction if missing or poorly done. In the middle, customers are neutral, they don’t notice or care much about the feature. At the top, the feature creates delight and excitement, often going beyond expectations. It’s essentially the demand side: how customers perceive the value of what’s provided.
Within this framework of satisfaction vs functionality, there are three types of capabilities or features. Table stakes, Satisfiers, and Delighters.
Some features are mandatory, others create linear value, and a few create delight. The Kano model is the tool for sorting them.
Table stakes: If missing, the product feels broken. Compliance, exports, and reliability often fall here. Once covered, more polish adds little incremental value.
Satisfiers: Direct levers of value. Investment translates proportionally into customer satisfaction and willingness to pay. Think dashboards, speed, or automation.
Delighters: Unexpected, memorable features. They create pull and pricing power. For example, an AI “coach” suggesting next best actions.
By classifying requirements this way, teams can avoid overinvesting in Table Stakes or chasing endless “nice to haves.”
Here’s how we thought about “calls” in Slack and how it could be mapped into the three Kano categories with distinct use cases.
Table Stakes
Use Case: Basic One-to-One Calling
Situation: A user needs to escalate a quick conversation from text to voice.
Expectation: They can click a button in Slack and instantly start a basic voice or video call with another user.
Why it’s Table Stakes: If Slack didn’t have this, the product would feel broken compared to alternatives like Teams or Zoom. But once the feature exists and works reliably, adding more polish doesn’t meaningfully increase perceived value. ie. It doesn’t close more deals or increase price.
Satisfier
Use Case: Reliable, High-Quality Group Meetings
Situation: A team of 6-10 people schedules a weekly check-in and decides to run it entirely within Slack.
Expectation: The call has reliable connectivity, screen sharing, recording, and integration with Slack channels so discussions stay linked to ongoing work.
Why it’s a Satisfier: The better the quality, stability, and feature richness, the more valuable the experience. And the more likely customers will adopt Slack as their primary communication hub. Performance scales linearly. Every improvement drives more satisfaction and willingness to use Slack over Zoom or Meet. More deals are closed and higher prices can be charged once the perceived customer satisfaction measure has cleared zero.
Delighter
Use Case: AI-Powered Meeting Summaries in Context
Situation: A manager joins a Slack call but can’t stay for the full meeting.
Expectation: After the call, Slack automatically generates a summary, action items, and links them back to relevant channels and files.
Why it’s a Delighter: This goes beyond what most users (used to) expect from a call tool. It feels like magic. Saving time, improving productivity, and increasing Slack’s stickiness. Over time, of course, competitors may catch up, and this feature could migrate into the “satisfier” category. Which is the case with all of the AI notetakers now on the market. And why these companies are in danger of becoming “features” rather than sustainable products and companies.
Note that within each of these use-cases there are dozens of individual features. Hundreds of user stories and backlog tickets. It’s important to keep at the high-level and out of the weeds of individual features.
Step 5: Balance with Goals, OKRs, and KPIs
Now we have product capabilities mapped against the value customers would perceive the solution to have. Table Stakes remove blockers to close deals. Satisfiers deliver incremental value that help us penetrate more deeply into customers. And Delighters differentiate us from competitors and enable us to position and price as a premium provider. But we can’t do it all.
With competing priorities and resources, we need goals to break the deadlock. An OKR, Object and Key Result, is a measurable goal. And the company needs them to inform decisions and bring clarity to “the why” we’re building something for the business now.
A company of any size should have no more than three OKRs. When I joined Slack, we had eight and it resulted in poor prioritization and a lack of focus in our efforts. When everything is a priority, nothing is. The following year we had three and life was much easier.
It is tempting to have revenue as an OKR. Unfortunately, for a growth startup in particular, that’s kind of like the business equivalent of making “lines of code” a metric of success for engineering. Neither of these metrics help make decisions and both of which can result in poor behaviors.
Decide on OKRs that are going to encourage desired and consistent behaviors in and across teams and ease decision making when conflicts or disagreements arise. For example, increase the number of new customer logos by 20%. Increase our Monthly Active Users (MAU) within target accounts by 25%. Increase our Average Contract Value from $25,000 to $50,000 by the end of the year.
Notice, all things being equal, accomplishing each of these goals will increase the revenue of the company. But in each case we have goals that are actionable and can be accomplished in different ways.
Side note: That last piece is very important. For a company or a team to be able to reach a metric (KR) in different ways is the definition of “Agile”. Keep the target constant and give the empowered team autonomy to adapt and make efficient progress quickly.
Step 6: Bring it All Together
From the top, we now have a defined target market segment with measurable characteristics exemplified by our canonical customer, Nike.
We have a product marketing architecture (”markitecture”) showing domains that collect a coherent set of capabilities or features to help us reason and prioritize.
We have the high-priority Jobs-to-be-Done for each domain so we’re no longer thinking about features, but are now customer-centric in our conversations and our thinking.
We have each JTBD mapped against perceived customer value and the level of completeness in delivering on those customer expectations.
We now have a small, measurable, and well understood set of company goals the whole organization is aligned on.
As a rule of thumb, most SaaS products teams should have a balanced portfolio per planning cycle. 2-3 Table Stakes (close gaps, unblock sales); 3-5 Satisfiers (drive measurable revenue impact); 0-1 Delighters (innovation bets with asymmetric upside).
Table Stakes
You should only commit to as many as necessary to unblock adoption or remove critical objections. These don’t create delight or pricing power, but missing them means the customer will not buy. For most teams, this means a handful at a time (2-3 per quarter). enough to close competitive gaps or enable sales, but not so many that you sink time polishing things customers won’t pay more for.
Satisfiers
This is where you should spend the majority of your investments. These features directly influence ARR, ASP, and NRR (Net Retention Rate) as every incremental improvement increases value. Typically, you’d want 3-5 major performance bets per quarter, often aligned with your key KPIs (Key Performance Indicators (e.g., faster onboarding, deeper integrations, higher reliability). These should map directly to revenue efficiency metrics (ARR/FTE, win rate, retention).
Delighters
Commit to very few at once. These investments are expensive, risky, and often multi-quarter bets. A realistic ratio is 1 big delighter per cycle (or every 2-3 quarters for early-stage teams). Think of these as innovation bets that can justify price uplifts, differentiate in crowded markets, or generate PR buzz. The goal isn’t volume, but impact: one breakthrough delighter can be more valuable than ten incremental improvements.
Step 7: Build the Roadmap
With segments, domains, jobs, Kano categories, and company goals in hand, it is time to translate strategy into execution. This is where prioritization becomes real, because the roadmap is constrained not by ideas, but by engineering capacity.
Allocate Engineering Resources Intentionally
Engineering effort is finite. Each quarter or cycle, teams should allocate resources across three categories:
Table Stakes: Allocate just enough to unblock adoption or remove critical objections. These do not justify ongoing heavy investment, but they are necessary to close competitive gaps or unlock deals.
Satisfiers: The majority of engineering capacity belongs here. These are the features that directly drive revenue and usage at lower risk.
Delighters: Reserve a smaller portion for one big bet. This allocation may span multiple quarters and requires leadership conviction.
As a heuristic, many high-performing teams target something like: 20% Table Stakes, 60% Satisfiers, 20% Delighters. Ratios can shift based on stage of company, competitive pressure, or major customer commitments.
Manage Trade-Offs and Resource Contention
The hard part in this whole process is not identifying opportunities, but making tradeoffs explicit. Some examples:
Closing deals vs scaling architecture: Do you fix the missing compliance feature to win an enterprise deal, or invest in workflow scalability that serves all future customers?
Speed vs depth: Do you push out a lightweight version of analytics for mid-market accounts, or double down on advanced reporting for enterprises?
Revenue this quarter vs strategic differentiation: Do you deliver the one feature blocking several deals, or continue investing in a multi-quarter delighter that could shift your category positioning?
By framing these conflicts in terms of segments, goals, and Kano classification, teams can debate openly and align on tradeoffs without devolving into politics and feature squabbles.
Account for Dependencies Between Domains
Roadmaps are not just lists of features; they are systems of interdependent capabilities. Dependencies between domains and the underlying architecture need to be acknowledged early:
Foundational layers: Improvements to API, permissions, or data model may be required before higher-level features can be delivered.
Cross-domain orchestration: Adding workflows often depends on two or more domains being sufficiently robust.
Analytics and activation: Advanced reporting or AI inference requires reliable data capture, as well as scalable infrastructure for storage and querying.
Delighters on shaky ground: A flashy AI assistant or advanced automation won’t create lasting value if core reliability or integration gaps undermine trust.
Mapping these dependencies visually helps you plan sequencing. A high-scoring feature may not be deliverable until its architectural prerequisites are in place.
Deliverables of Step 7
At the end of this step, the team should have:
A quarterly roadmap with P0/P1/P2 items, mapped to OKRs and Kano categories.
Capacity allocation plan across Table Stakes, Satisfiers, and Delighters.
Tradeoff log capturing the biggest conflicts discussed and the rationale for the decision.
Dependency map identifying technical prerequisites and sequencing needs.
This is the moment where strategy turns into execution. The roadmap should not just reflect what the company hopes to build, but what it has consciously chosen not to build, at least not yet. That discipline is what keeps product organizations focused and credible.
The biggest risk for any product team is not choosing the wrong feature, but choosing too many without a framework. Prioritization is not about saying yes to everything, it is about saying yes to the right things with conviction and not yet to the rest with confidence.
The process outlined here gives you the tools to do just that: define your segments, capture jobs-to-be-done, map domains, apply Kano, balance with goals, and build a roadmap that reflects both customer needs, business strategy, and engineering capacity.
The best way to start is simple: gather your product, sales, and engineering leaders for a two-hour workshop this week. Pick one segment, build the first problem × domain matrix, and classify the top three jobs with Kano. Once you take that first step, you’ll have a shared language and a foundation for every roadmap discussion that follows.
Don’t let the perfect get in the way of the good.
Start now!