
The Three Product Market Fit Metrics
Objectively determine if you've achieved product-market fit

In 2023, I published a framework for evaluating when a company is truly ready to scale, beyond just revenue growth or anecdotal signs of customer happiness. That research helped shift the conversation around Product Market Fit (PMF) from vague sentiment to measurable signals. During that time, AI came center stage.
AI is redefining how quickly teams can iterate toward PMF. From customer research and product experimentation to sales enablement and support automation, AI is compressing time-to-value across the entire product lifecycle. This increase in execution speed means that companies can hit the early milestones of traction faster, but it also increases the risk of scaling prematurely, before sustainable demand and organizational efficiency are in place.
In this updated paper, we revisit the most critical leading indicators of PMF—Customer Acquisition Cost Payback, Net Dollar Retention, and Revenue per FTE—and show how they reflect the balance between product value, market pull, and company-wide scalability. I also show where AI is driving PMF metrics
With AI accelerating both opportunity and complexity, these metrics are more important than ever to ensure you're not just moving fast, but moving in the right direction.
PMF - Not These Metrics
Revenues and Customer Satisfaction (NPS or anecdotal reviews) are useful measures, but they alone are not sufficient to determine when you’re ready to scale. These metrics are very laggy and provide a limited understanding of how you’re operating.
It is very tempting for the board and company OKRs (Objectives and Key Results) to pick revenue and NPS as the guiding light. However, relying solely on these metrics can create a false sense of security and lead to pulling the trigger on scale too soon. This is what happened at Spendesk when we started scaling out the go-to-market motion before the underlying product and fundamentals were not ready.
Product Market Fit is not just about how effectively your organization can push a product into the market (Supply), but it also indicates how much customers are pulling your product into the market (Demand) and how efficiently your organization can meet that demand.
There are two metrics that indicate the market is starting to pull you in and that you have the two engines of growth in place - product and distribution. Additionally, as you scale the company, there is one metric you need to pivot towards as you transition from a startup to a scale-up.
Customer Acquisition Cost Payback
CAC Payback is a measure, expressed in months, that indicates how long it takes for the margins from your product to cover the cost of making the sale and begin generating cash flow, also known as Free Cash Flow (FCF). The following illustrates the progression of a healthy CAC Payback, as described in the 2024 SaaS Benchmarks Report, released by High Alpha.
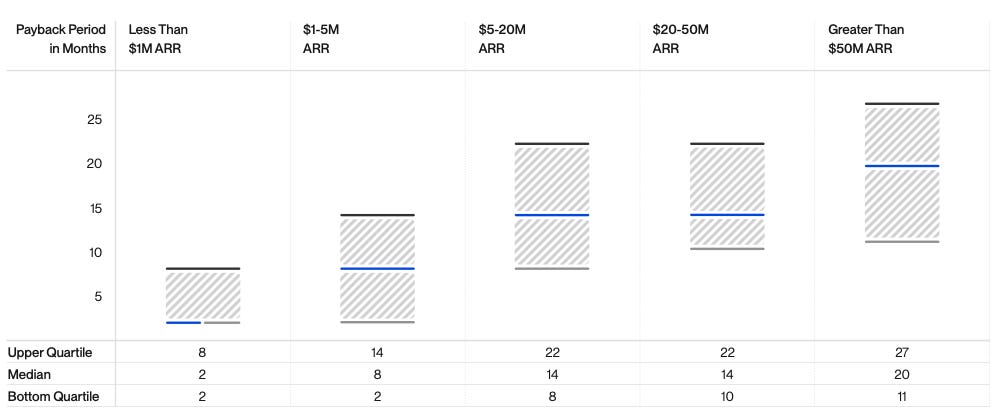
Early in the life cycle, CAC Payback is low because the product is differentiated, meets the expectations of the customer, it’s easy to understand, easy to sell, and relatively easy to buy.
This is when you invest in the value, quality, and differentiation of your product. Meet an intense and frequent need of your customer. Your customer’s willingness to pay increases, your ASP rises, and your CAC Payback goes down.
With the rise of AI, CAC Payback for companies with less than $1M ARR has gone down to just 2 months for the best-performing companies. This is likely due to increased proficiency in Product-Led Growth mechanics and improved sales intelligence and efficiencies through the use of AI-supported tools for a Product-Led or completely Sales-Led Growth motion.
If your CAC Payback is at 20+ months when you’re between $5M-$20M ARR, your commercial organization is having to invest too much to get the customer over the line to monetize them. Alternatively, your Average Selling Price (ASP) or Average Contract Value (ACV) is too low.
Not only do you not have PMF, but those dollars you’re investing in Sales and Marketing are not being invested in Product and Engineering. The gap between the product and customer expectations begins to widen. So you lose twice as you try to force sales (a strategy that was heavily leveraged in the “Growth at all Costs” days of the early 2020s.
If the cost of generating demand is going down through organic word-of-mouth marketing, Product-Led Growth mechanisms, and your sales folks feeling like the product is “selling itself”, the time it takes to pay back your customer acquisition costs will decrease. So why does CAC Payback increase as the company grows?
This tells you more about the type of customer you’re engaging rather than where the product is. It shows that you’re transitioning from the early adopter and visionary customer to a more demanding and cautious customer profile. You’re building awareness through marketing. Or you’re starting to move up-market. ACV (Average Contract Values) is increasing, and so sales cycles become more expensive in terms of time and capital.
The key is that you’ve put the investment into the product and the R&D organization before you make that transition. So the company as a whole is prepared to address the next phase of scale.
Net Revenue Retention Rate
“The cheapest customer to get is the one you’ve already got”.
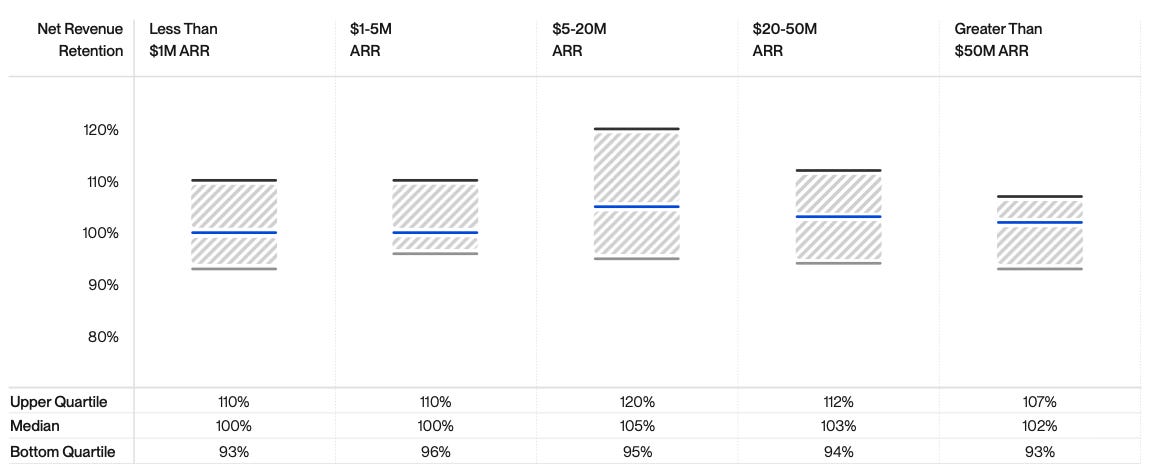
Net Revenue Retention Rate is calculated by taking the revenue generated from existing customers (including upsells, cross-sells, and renewals) over a specific period and dividing it by the revenue from those same customers in the previous period. Expressed as a percentage, it should be over 100%. Each acquired customer is generating more revenue over time.
From a product perspective, we can look at user engagement as a KPI (Key Performance Indicator). But in the economic context of PMF, it’s only when we have paying customers increasing their financial investment in the product that we see that demand is increasing and PMF has been reached.
Customers are increasing their financial investment in your product by increasing the number of seats they purchase, upgrading to your more expensive SKUs, purchasing additional products, and otherwise looking to do more with the software you build and sell. All of this requires investment in R&D to ensure you have the breadth of offering to support these motions.
If you’re landing the first couple of users quickly, but it’s taking tremendous effort to get the rest of the target users onto the product, you do not have PMF. Similar to making the first sale and driving CAC Payback down through product value, your product now needs to go to work and expand throughout the customer’s employees. And it needs to offset the loss of revenue from those customers who churn.
On the one hand, you’re building value and clear upgrade paths to increase ACV over time. At the same time, you’re building PLG (Product-Led Growth) and PLS (Product-Led Sales) growth mechanisms to turn existing users into advocates to grow your user base. You’re also partnering very closely with Customer Success as they build upon the product’s obvious benefits and run expansion playbooks to enable the customer to get more value out of the product.
Overall, if your overall ARR is between $1M and $50M, you should be aiming for an NRR of between 110% and 120%. The higher the better.
Company Efficiency
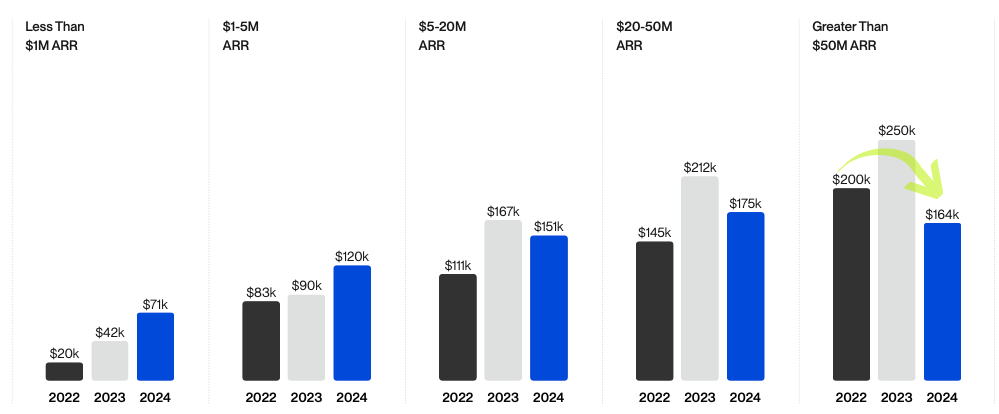
To declare Product Market Fit is to say the company as a whole has reached a predictable and sustainable level of revenue-generating efficiency. For a SaaS company, this is measured in terms of revenue divided by the number of full-time employees (FTE) across the company: ARR/FTE.
When I speak to executive teams across the startup landscape, I am shocked at how little attention is paid to this metric.
According to High Alpha’s research cohort, this is how ARR/FTE evolves as the startup begins to transition to scale.
At the early stage, revenue-generating efficiency is low, but R&D efficiency needs to be high as the team is quickly iterating towards the solution to a clearly identified and valuable customer pain.
As CAC Payback moves down and NRR goes up, you’re in the zone of PMF. You’re moving beyond building a product, and you’re in the company-building phase. You continue to invest in R&D, and you’re starting to scale up sales and marketing. However, you need to take a step back and ensure you’re investing in the overall operations of the company.
Early on in the life of the company, you’re throwing humans at problems for speed. Providing “white-glove” service to better understand the customer and leveraging Mechanical Turk strategies to deliver value while you’re still working out what that value is.
It’s at this stage that you invest in the product, company tooling, etc., and start replacing human effort with software across the entire pipeline. Your product, infrastructure, tooling, and processes all the way from engineering and out through sales and support. All are up-leveled and matured to scale.
AI’s Impact on Efficiency
Today, with the rise of AI, more tools are available at lower price points to increase efficiency.
There are tools available from the incumbents. However, the startup ecosystem is buzzing with innovation across every layer of the modern software stack.
Customer Support
In Customer Support, companies like Zowie and Klaus (acquired by Zendesk) are using AI to automate responses and improve quality assurance.
Content Creation
Content Generation tools such as Jasper and Copy.ai help marketing teams scale content faster than ever.
Data Analytics
In Data Analytics, startups like Y42 and Count are rethinking how teams model and collaborate on data.
Workflow Automation & Personalization
Workflow Automation is seeing rapid growth through platforms like n8n and Tines, while Personalization tools like Mutiny and Aampe enable tailored user experiences at scale.
Marketing & Sales
On the Marketing & Sales front, Apollo.io and Breadcrumbs.io are arming go-to-market teams with richer insights and smarter lead scoring.
Security
In Security, Vanta and Sealcube are streamlining compliance and access control.
Product Development
Product Development is getting a boost from tools like Linear and PostHog, which combine speed with insight. In the world of
Creative Design
Creative Design, startups like Runway and Uizard are redefining how teams prototype and produce content.
Integration Management
And powering connectivity behind the scenes, Integration Management players like Merge and Paragon make it easy to embed third-party integrations with minimal effort. Together, these companies represent a new wave of focused, flexible, and AI-native tooling.
Conclusion
In conclusion, reaching Product Market Fit (PMF) is a crucial milestone for any organization. While metrics like revenues and customer satisfaction provide valuable insights, they alone are not enough to determine if PMF has been achieved.
Instead, it is important to focus on metrics such as Customer Acquisition Cost Payback, Net Dollar Retention Rate, and Company Efficiency.
More than anything, the rise of AI and its use in the product development and distribution process can have an outsized impact on all of these metrics.
By understanding and monitoring these metrics, organizations can make well-informed decisions about scaling to ensure sustainable growth. Remember, achieving PMF requires a balanced approach. It takes orchestration and timed investment balancing across the entire company to scale and reach revenue-generating operational efficiency.